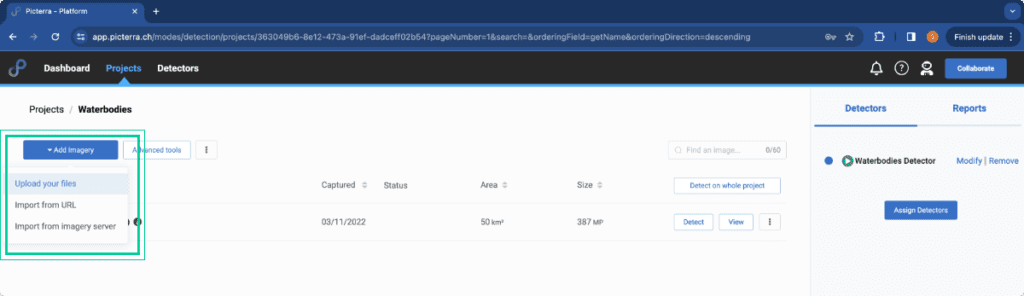
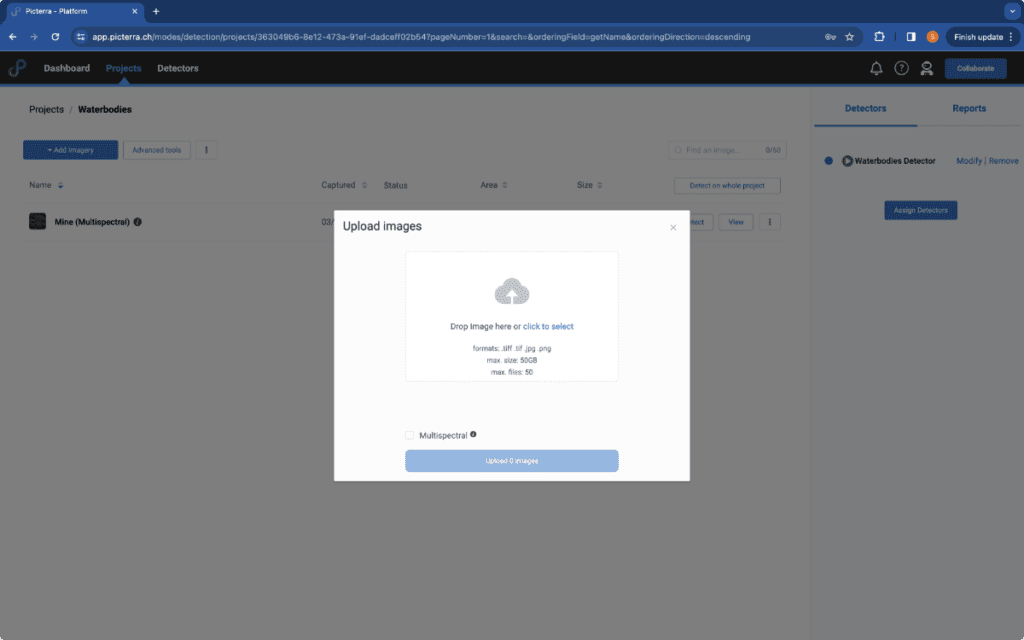
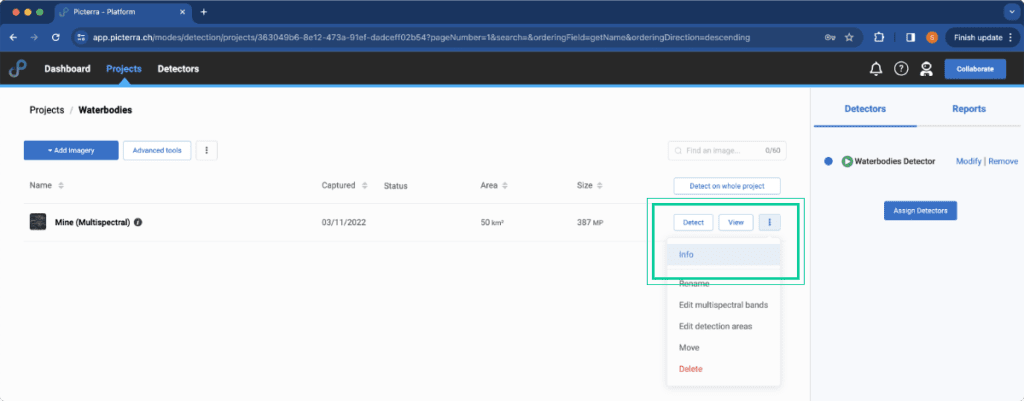
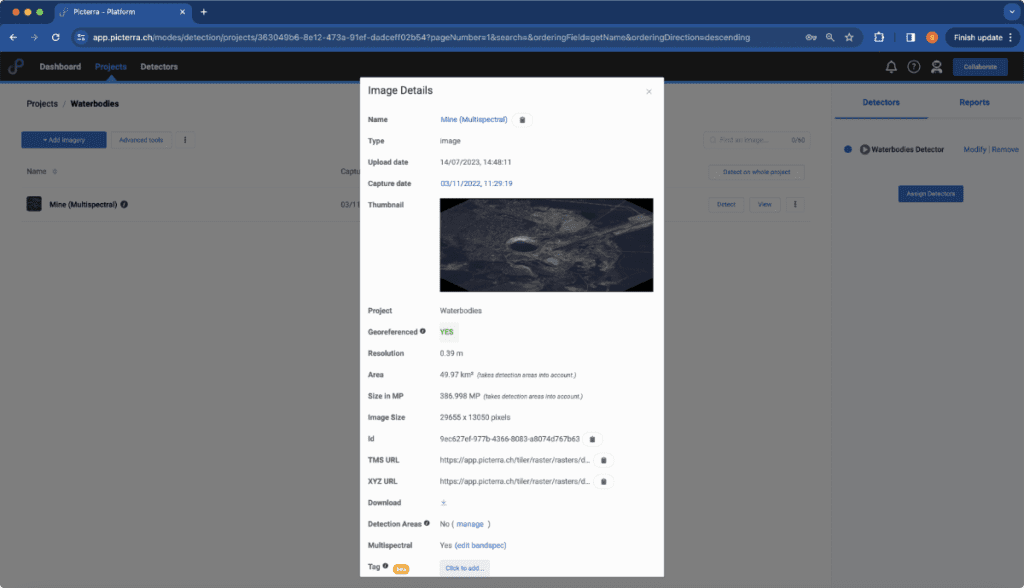


Allows to change how the image is displayed in the platform, for example when drawing annotations or checking prediction results.
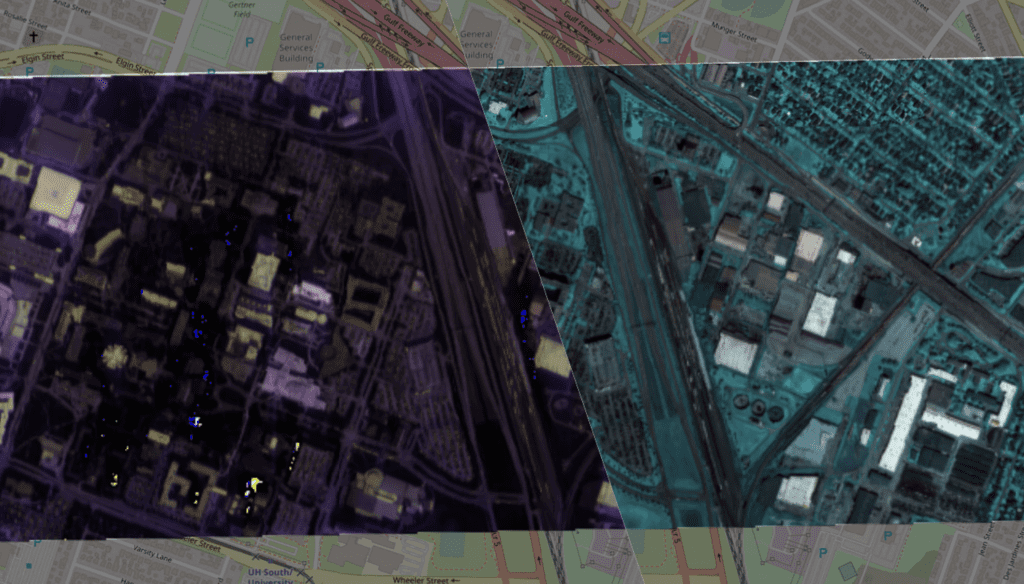
You can configure multiple band settings, the first one is used as default for displaying the image. For each band setting, you can enter a name, and a combination of three bands (R, G, B) that are used for displaying the image.
The “View” column indicates which combination of bands is currently enabled for preview on the right:

Band settings do not affect the way the detector “sees” your image, but it’s for convenience, for example some band combinations ease the annotations task.


